How Birthday Club App Drove 2,662 App Installs and Cut CPI by 47%
From zero properly optimized campaigns to 2,662 app installs across two markets, with cost per install dropping from $7.36 to $3.90 through systematic creative testing and campaign restructuring.
An Account Built on the Wrong Foundation
Birthday Club App aggregates birthday deals, free desserts, and meal discounts from local restaurants into a single mobile app. When we took over the account, the app had been running paid media for over a year with zero app install campaigns.
An 87-point audit revealed fundamental structural problems: the account was running only traffic ads and one low-budget lead ad, both with the wrong optimization objective. All languages were targeted instead of English-only, there were no retargeting audiences, no custom or lookalike audiences, campaigns were incorrectly optimized for traffic instead of installs, and ads pointed to a restaurant subdomain instead of the app store. Every dollar spent had been working against the client's actual business objective.
Rebuilt from Scratch with Systematic Testing
We rebuilt the entire campaign architecture from the ground up with proper app install campaigns and correct optimization objectives. The strategy centered on systematic creative testing: 8 creatives were run through 6 rounds of CPC analysis to identify the top performers.
We implemented birthday-targeting audiences and A/B tested birthday-specific versus broad targeting, segmented by gender and market. Campaign consolidation was critical: we killed underperforming campaigns, consolidated into focused structures, turned off expensive retargeting running at $10.22 CPI, and reduced from 5+ fragmented campaigns to 2-3 focused ones.
From Broken Campaigns to Voluntary Budget Increases
The restructured campaigns delivered transformative results. Cost per install dropped from $7.36+ down to $3.90, a 47% reduction. During the peak scaling period, installs grew 46.8% month-over-month, jumping from 503 to 738 in a single 30-day window.
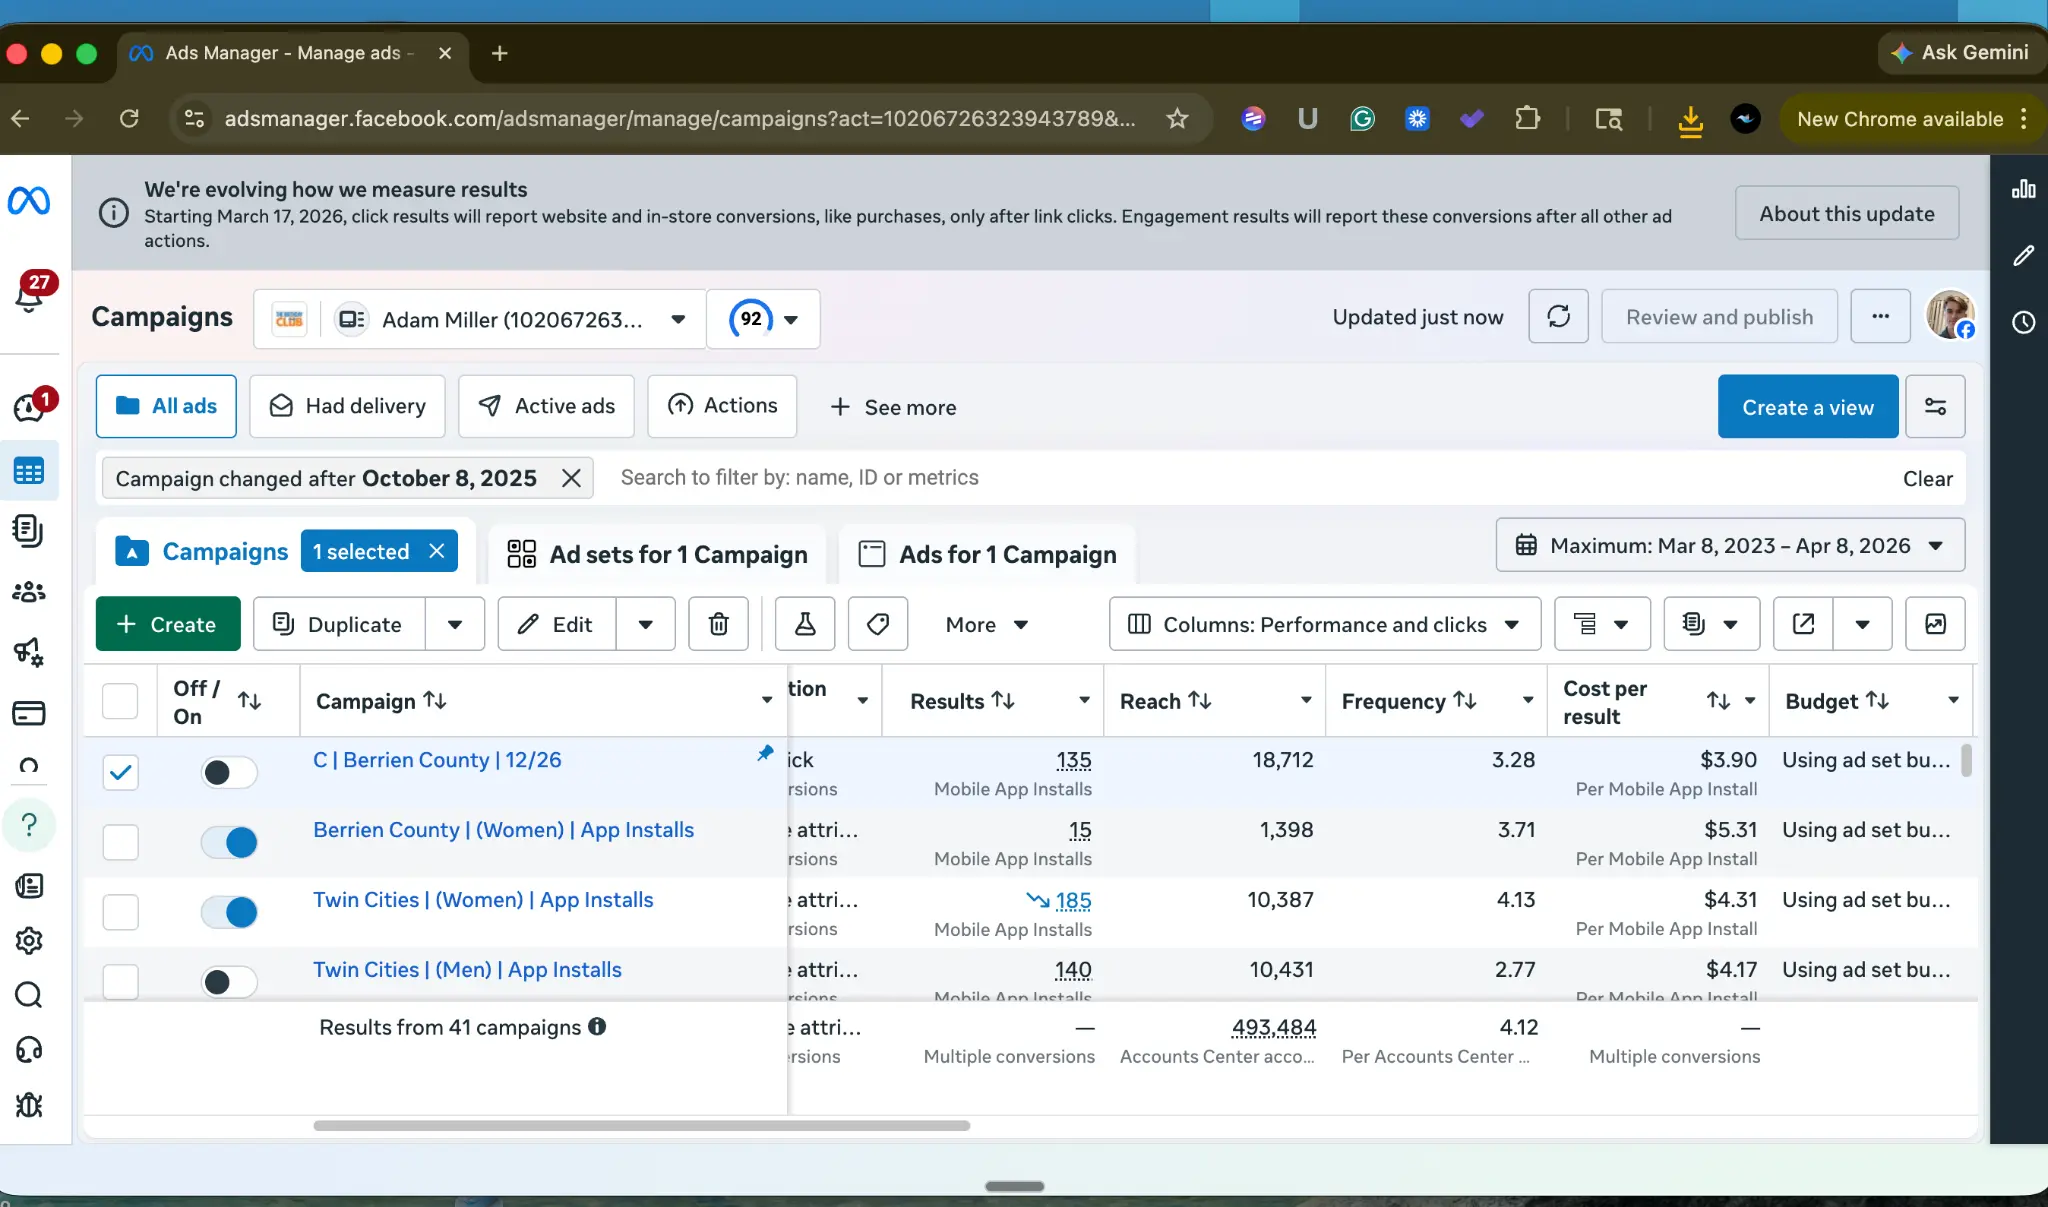
Active Campaign Breakdown by Market
Each market received tailored targeting, creative, and budget allocation based on performance data.
| Campaign | Installs | CPI | Reach | Frequency |
|---|---|---|---|---|
| C | Berrien County | 12/26 | 135 | $3.90 | 18,712 | 3.28 |
| Twin Cities | Women | 185 | $4.31 | 10,387 | 4.13 |
| Twin Cities | Men | 140 | $4.17 | 10,431 | 2.77 |
| Berrien County | Women | 15 | $5.31 | 1,398 | 3.71 |
Total App Installs Driven
From an account that had zero properly optimized app install campaigns, we built an engine that delivered 2,662 installs across two markets. The client voluntarily increased their monthly budget from $2,000 to $3,500, a 75% increase, and is now pursuing government funding to finance further scaling with plans to expand nationally.
Systematic Creative Optimization
Eight creatives were tested across six rounds of CPC analysis. Gender-specific winners emerged, enabling precise targeting per market.
| Creative | Winning Audience | Market | Performance |
|---|---|---|---|
| Pink Background Woman | Men | Both Markets | Top CPC performer for male audiences |
| Yellow Background Woman | Women | Both Markets | Top CPC performer for female audiences |
| DEALS Campaign | N/A | N/A | Killed: underperforming |
| Retargeting | N/A | N/A | Turned off: $10.22 CPI |